.svg)

What happens when you analyze 400 days of real estate activity, nearly 8,500 home sales, $7.5 billion in volume, 700+ neighborhoods, and more than 4,200 real estate agents? You get one of the most detailed looks at who is actually driving the Coachella Valley housing market.
Coachella Valley Real Estate Sales Overview
Over a 400 day period, the Coachella Valley real estate market recorded nearly 8,500 home sales worth about $7.5 billion. This report is based on closed sale data, not estimates, list prices, or projections.
More than 4,200 real estate agents participated in those transactions, generating about $300 million in commissions.
The numbers reveal a market shaped by both everyday home sales and high end luxury properties. The median sale price was $595,000, while the average reached $882,759, reflecting the impact of larger transactions across the valley.
The sections below break down the data by city, neighborhood, community, and agent to show where sales activity was concentrated, which areas generated the most volume, and who sold the most real estate during the reporting period.
By the Numbers
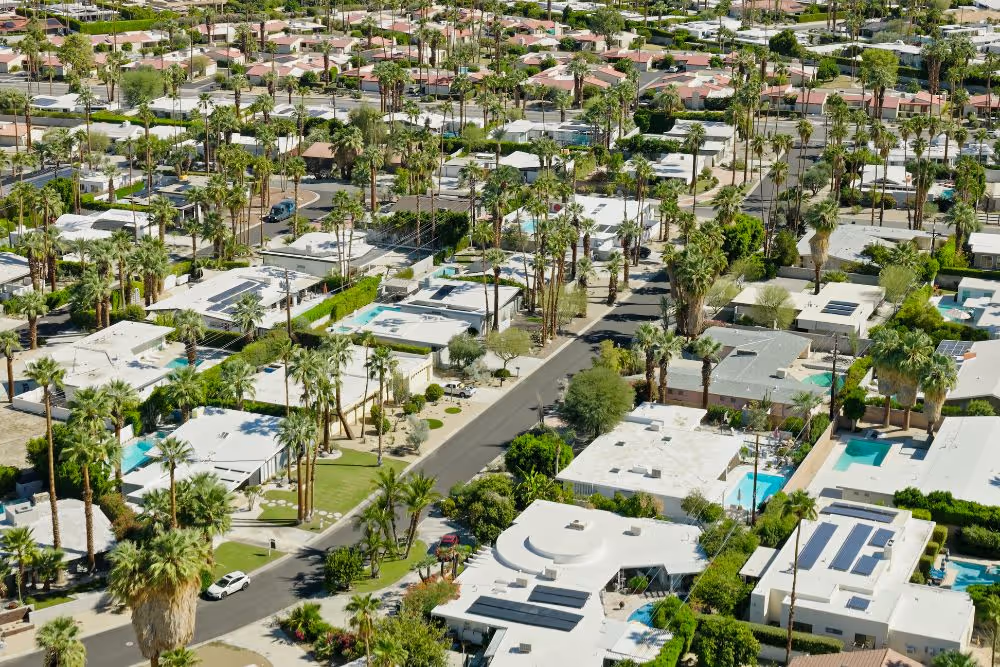
These figures cover 400 days of activity across La Quinta, Palm Springs, Palm Desert, Rancho Mirage, Indio, Indian Wells, Cathedral City, Desert Hot Springs, Bermuda Dunes, Coachella, and Thousand Palms.
Search Realtor Sales Production
Want to look up a specific agent? This searchable directory covers every one of the 4,000-plus realtors in the data. Type a name, sort by any column, and page through the full list.
| Agent | Total Sides | Sellers | Buyers | Avg Price | Volume |
|---|
Local Community Search
Search over 700 communities and see which agents are doing the most business in each neighborhood. View the top 10 realtors by sales volume and see each agent's buyer vs. seller representation breakdown.
| Realtor Name | Total Sides | Buyers Rep. | Seller Rep. | Total Sold Volume |
|---|
Why Median Matters More Than Average
For each city I list the total sales volume first, then both the average and the median price. Total volume tells you how much money moved. Average and median tell you what a single home cost, and they often disagree by a lot.
Here is the catch with average. A handful of multi-million dollar estate sales drag the average way up, so the average can make a city look pricier than the home most people actually buy. The median is the middle sale, the point where half the homes sold for more and half sold for less. One giant sale does not move it.
Look at La Quinta. The average is $1,321,195, but the median is $800,000. That half-million dollar gap is the luxury market talking, not the typical buyer. When the average sits far above the median, trust the median.
Coachella Valley Sales by City
| City | Homes Sold | Total Volume | Avg Price | Median Price | |
|---|---|---|---|---|---|
| Palm Desert | 1,814 | $1.35B | $745,273 | $560,000 | |
| Palm Springs | 1,747 | $1.53B | $876,453 | $650,000 | |
| La Quinta | 1,231 | $1.63B | $1,321,195 | $800,000 | |
| Indio | 1,121 | $655.5M | $584,702 | $538,500 | |
| Rancho Mirage | 827 | $1.03B | $1,251,141 | $855,000 | |
| Cathedral City | 583 | $298.6M | $512,112 | $504,000 | |
| Desert Hot Springs | 543 | $220.0M | $405,183 | $400,000 | |
| Indian Wells | 277 | $550.6M | $1,987,608 | $1,450,000 | |
| Bermuda Dunes | 125 | $95.9M | $766,903 | $650,000 | |
| Coachella | 110 | $55.0M | $500,369 | $494,000 | |
| Thousand Palms | 53 | $22.9M | $431,522 | $394,000 |
Real Estate Commission
This report analyzes 400 days of real estate activity across 700+ Coachella Valley neighborhoods, covering approximately $7.5 billion in home sales and 4,248 real estate agents.
The data shows a highly concentrated market where a small group of agents handles most of the business. Just 277 agents, or 6.5% of all agents, generated 50% of the total sales volume.
The top 20% of agents produced 72.1% of all sales volume and handled 66.5% of all transaction sides.
Most agents completed very few transactions during the reporting period. A total of 2,177 agents, or 51.25%, recorded only one transaction side.
Another 648 agents recorded exactly two sides. Overall, 66.5% of agents completed fewer than three transaction sides, 78.5% completed fewer than five sides, and 89.9% completed fewer than ten sides.
The average agent recorded just one transaction side in a 400 day period.
Sales volume was also concentrated among a small number of agents. Only 7 agents generated more than $100 million in sales volume, 28 agents exceeded $50 million, and 72 agents exceeded $25 million.
At the other end of the market, 2,089 agents, or 49.2%, generated less than $1 million in sales volume.
Buyer and seller representation was uneven as well. A total of 1,690 agents never represented a seller, while 1,092 agents never represented a buyer.
Using an estimated 2% commission per side, only 7 agents likely generated more than $2 million in gross commissions, while 28 agents likely exceeded $1 million and 72 exceeded $500,000.
In contrast, 2,089 agents likely generated less than $20,000 in gross commissions, 3,075 generated less than $50,000, and 3,591 generated less than $100,000.
While top producers can generate more than $4 million annually in gross commissions, the typical agent generated approximately $20,450 in gross commission during the reporting period. These numbers highlight how commission income, like sales volume, is concentrated among a relatively small group of agents.
Top Agent in Each City
These are the agents who recorded the most transaction sides in each city during the reporting period. Transaction sides include both buyer and seller representation.
| City | Top Agent | Combined Sides | Volume | |
|---|---|---|---|---|
| Palm Desert | Michael Horne | 101 | ~$55.1M | |
| Desert Hot Springs | Todd Myatt | 74 | ~$33.4M | |
| La Quinta | John K Miller | 69 | ~$50.9M | |
| Indio | Jelmberg Team | 69 | ~$36.9M | |
| Palm Springs | Brady Sandahl | 64 | ~$79.2M | |
| Rancho Mirage | The Morgner Group | 52 | ~$45.5M | |
| Indian Wells | Team-Ford, Ginos, MacMaster | 43 | ~$150.2M | |
| Cathedral City | Holly Tait Markas | 42 | ~$15.6M | |
| Bermuda Dunes | Diane Flaherty | 26 | ~$19.3M | |
| Coachella | Ana Perez | 22 | ~$11.1M | |
| Thousand Palms | Angie Torres | 4 | ~$3.3M |
Top Realtors in La Quinta
La Quinta carries the heaviest luxury weight in the valley, and a few of these community totals show it. The Madison and The Hideaway alone produced some of the largest single-agent volume figures in the whole data set.
Top Realtors in Palm Desert
Palm Desert has the widest spread of communities in this data, from Sun City's high-volume turnover to the high-dollar fairway homes inside Bighorn and Indian Ridge.
Top Realtors in Indian Wells
Indian Wells is small in unit count but huge in dollars. Toscana, Vintage, and The Reserve show how a single dominant team can own a private community.
Top Realtors in Rancho Mirage
Rancho Mirage blends active-adult turnover at Del Webb with brand-new construction at Cotino, plus several established country clubs in between.
Top Realtors in Palm Springs
Palm Springs runs from historic estate neighborhoods like Old Las Palmas to newer builds in Escena. The volume per community is smaller, but the per-home prices in the older areas are not.
Top Realtors in Indio
Indio's listed communities are big active-adult and golf developments where a single team often dominates the resale traffic.
Top Realtors in Cathedral City
Cathedral City sits at a more attainable price point, and its leaders move steady volume through golf communities like Desert Princess and Cathedral Canyon.
Top Realtors in Desert Hot Springs
Desert Hot Springs is the most affordable corner of the valley. At Mission Lakes, a small group of agents handles most of the resale traffic.
Top Realtors in Bermuda Dunes
Bermuda Dunes is a smaller market, and BDCC Country is its center of gravity for resales.
Why Is a Construction Company Providing Real Estate Data?
At Truly Tough Contractors, we work with real estate professionals, home inspectors, buyers, and sellers throughout the Coachella Valley. As a multi-trade contractor specializing in roofing, solar, HVAC, plumbing, electrical, painting, and other home services, we understand how repairs, inspections, and maintenance issues can impact a real estate transaction.
Our goal is to provide helpful information and reliable resources that make it easier for everyone involved to make informed decisions.
In addition to this real estate data, we build free local tools for homeowners and real estate professionals. These include instant online quotes for new solar systems, solar panel removal for roof repairs, solar panel cleaning, painting projects, pool service and maintenance, and more.
We are continuously adding new calculators, instant quote tools, building permit search tools, HOA and property management directories, and contractor resources to improve transparency and save people time.
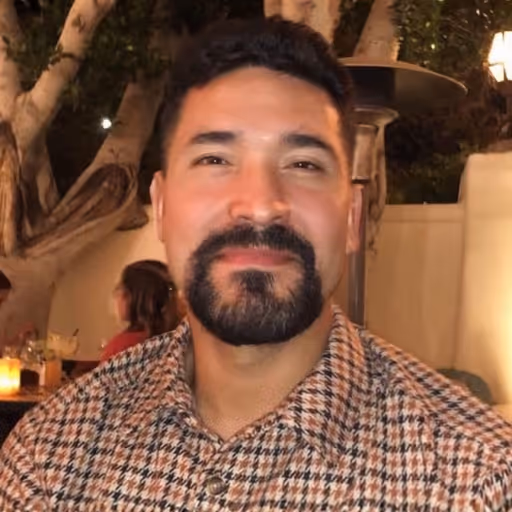
Truly Tough Contractors is led by Alber Melara, a roofer with more than 20 years of experience.
If you have questions about roofing, solar, HVAC, plumbing, electrical, or other home services, call (760) 343-5823. We're always happy to help.
Frequently Asked Questions
How much real estate was sold in the Coachella Valley?
Nearly 8,500 homes sold for approximately $7.5 billion during the 400 day reporting period.
How many real estate agents participated in these sales?
A total of 4,248 agents represented buyers, sellers, or both.
What was the median home price?
The median sale price was $595,000.
What was the average home price?
The average sale price was $882,759.
Why is the average home price so much higher than the median?
Luxury home sales pull the average higher, while the median better reflects the middle of the market.
How concentrated is the real estate market?
Just 277 agents, or 6.5% of all agents, generated 50% of the total sales volume.
What percentage of sales volume was controlled by the top 20% of agents?
The top 20% of agents generated 72.1% of all sales volume.
What percentage of transaction sides were handled by the top 20% of agents?
The top 20% handled 66.5% of all transaction sides.
How many agents recorded only one transaction side?
2,177 agents, or 51.25% of all agents.
How many agents recorded fewer than three transaction sides?
2,825 agents, or 66.5% of all agents.
How many agents recorded fewer than ten transaction sides?
3,821 agents, or 89.9% of all agents.
How active was the typical real estate agent?
The average agent recorded just one transaction during the reporting period.
How many agents generated more than $100 million in sales volume?
Only 7 agents exceeded $100 million in sales volume.
How many agents generated more than $50 million in sales volume?
Only 28 agents exceeded $50 million in sales volume.
How many agents generated less than $1 million in sales volume?
2,089 agents, or 49.2% of all agents.
How much commission was generated across all sales?
Approximately $300 million in commissions were generated using a conservative 2% commission estimate per side.
How many agents likely generated more than $1 million in commissions?
Only 28 agents, or 0.66% of all agents.
How many agents likely generated less than $20,000 in commissions?
2,089 agents, or 49.18% of all agents.
How many agents never represented a seller?
1,690 agents represented buyers but never represented a seller during the reporting period.
How many agents never represented a buyer?
1,092 agents represented sellers but never represented a buyer during the reporting period.